
Not My Problem: A Decision Heatmap Talk from Product Camp Pittsburgh 2026
My Product Camp Pittsburgh 2026 talk on the three quiet failure modes of matrixed organizations, the Owner-Decision-Date framework that fixes them, and the one-page decision-aging heatmap you can implement in a Google Sheet on Monday. Full recap, the artifact, the impact chart, and the deck as PPTX and PDF.
I gave this talk at Product Camp Pittsburgh 2026 on a Saturday morning to a room of product managers, delivery leads, and a handful of brave executives. The room was unstructured by design, the slot was 25 minutes, and the topic was the quietest failure mode in matrixed organizations: decisions that nobody believes they own.
The full deck is at the bottom of this post as both a PowerPoint and a PDF. The recap below is the talk in long form, with the artifacts you can build on Monday.
The opening question
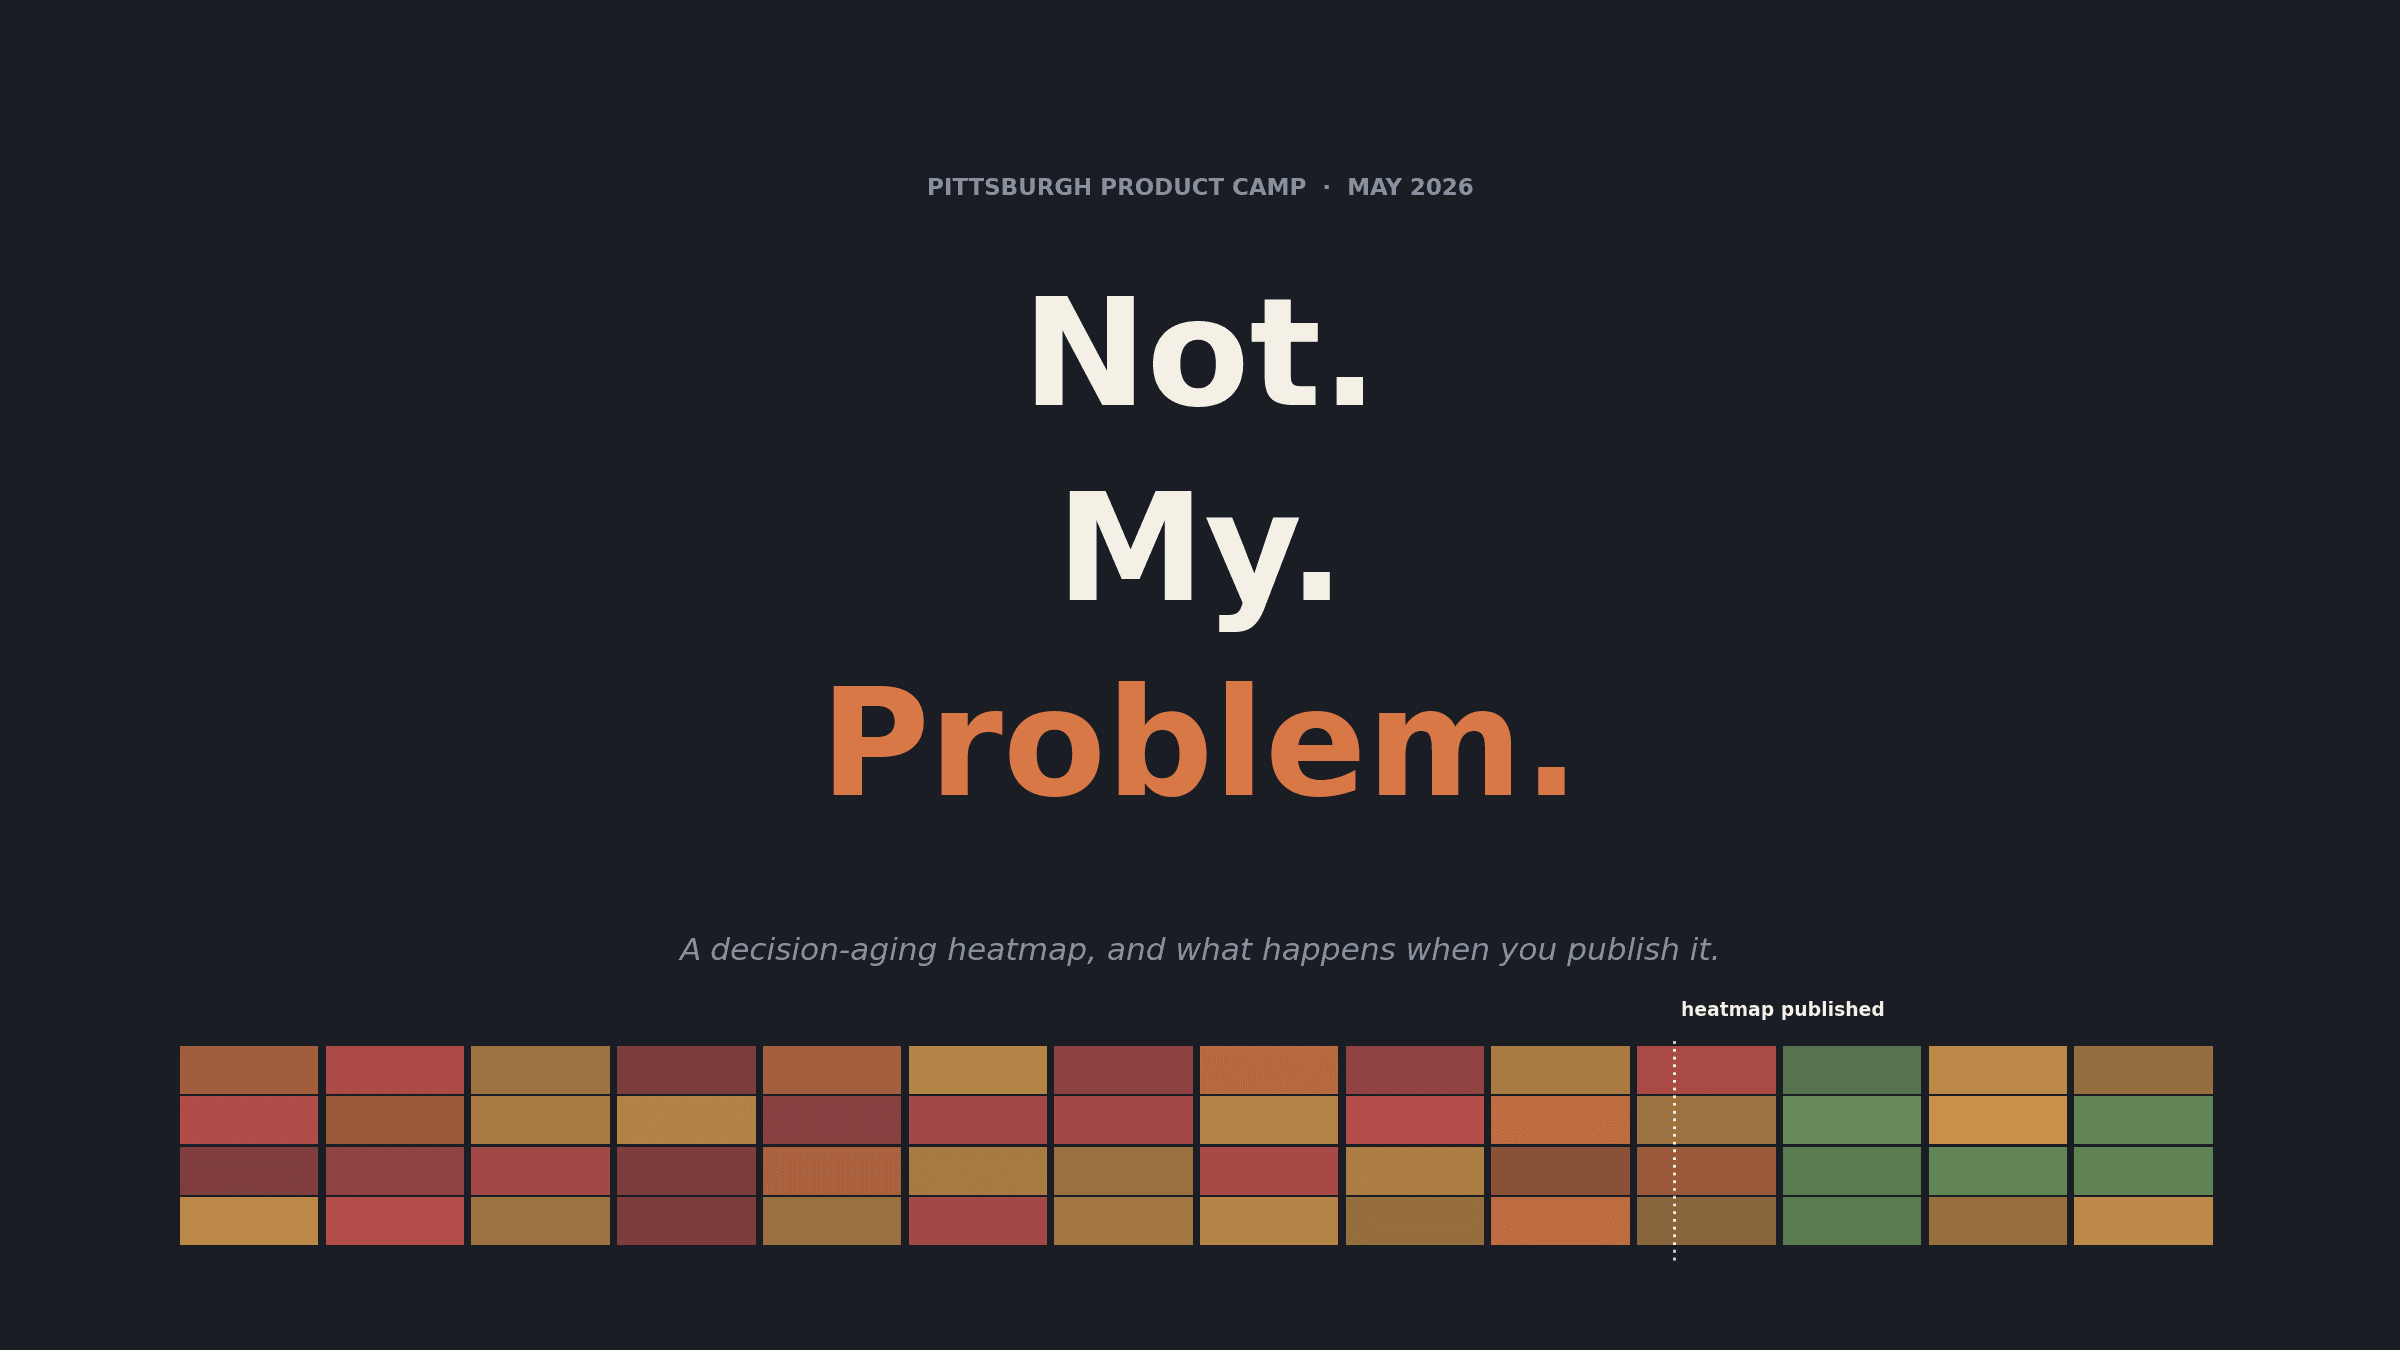
I started with one slide.
Who owns this?
In matrixed orgs, the most common answer is silence.
The room nodded. That nod is the whole talk in one gesture. We have all sat in the meeting where a hard call needed to be made, nine senior people were in the room, and the decision walked out the door unmade. Then it walked back in two weeks later, still unmade, with a slightly different bill of materials.
The diagnosis I have been carrying for five years across health systems, financial services, and platform engineering organizations is this: programs do not fail because hard decisions cannot be made. They fail because nobody knows whose decision it is. That sentence is the only one I asked the room to write down.
Three failure modes. Different teams. Same disease.
Three patterns show up in almost every matrixed organization I have audited. Most rooms ship all three at once.
Handoff theater. Teams write requirements and pass them along. Success is measured by "handed off," not by "worked." The work moves; the responsibility for the outcome does not.
Update chasing. Leadership reconstructs the program's reality from five different tools, and the answer changes per tool. The PM spends Tuesday morning preparing for the meeting where they will be asked questions whose true answer is "I cannot tell from these systems."
Decorative dashboards. Reports built for an executive to look at, not for a team to act on. Forty-seven green indicators and two red. The two red mean nothing; the forty-seven green mean less.
If you recognized your last steering committee in any of those, you are in the right room. The rest of the talk is the fix.
The fix is three words: See it. Own it. Move it.
01 · See it
Visibility is the intervention. That phrase is borrowed from public health and it transfers cleanly to delivery work. The single largest predictor of whether a program self-corrects is whether the right information is in front of the right person at the right cadence. Not "the right report." The right view.
The mistake most PMs make is building one view to serve three audiences. The exec wants to know what is at risk, what needs them, and what changed. The delivery lead wants to know what is blocked, who owns it, and what is aging. The engineer wants to know what is mine today, what changed, and what is next. If one report tries to serve all three, none of the three acts on it.
Build three views from one source of truth. Each one prompts a decision only that persona can make.
02 · Own it
One name. Not a team. Not "Eng leadership." A person.
If you cannot name them, you do not have an owner. You have a problem statement that needs one.
This is the single sentence that turns a stuck program around faster than any reorganization. Engineering leadership is not an owner. The Architecture Review Board is not an owner. A person is an owner. Someone still has to call the meeting and own the close-out.
03 · Move it
Every decision gets a date. Not the ship date. The decide date.
"We will follow up offline" is not a date. If you do not know when you will know, pick a re-evaluation date. Still a date. Publish the dates. Decision latency drops. Not by 10 percent. By half.
The framework: Owner. Decision. Date.
The whole system is three fields, published, visible to everyone.
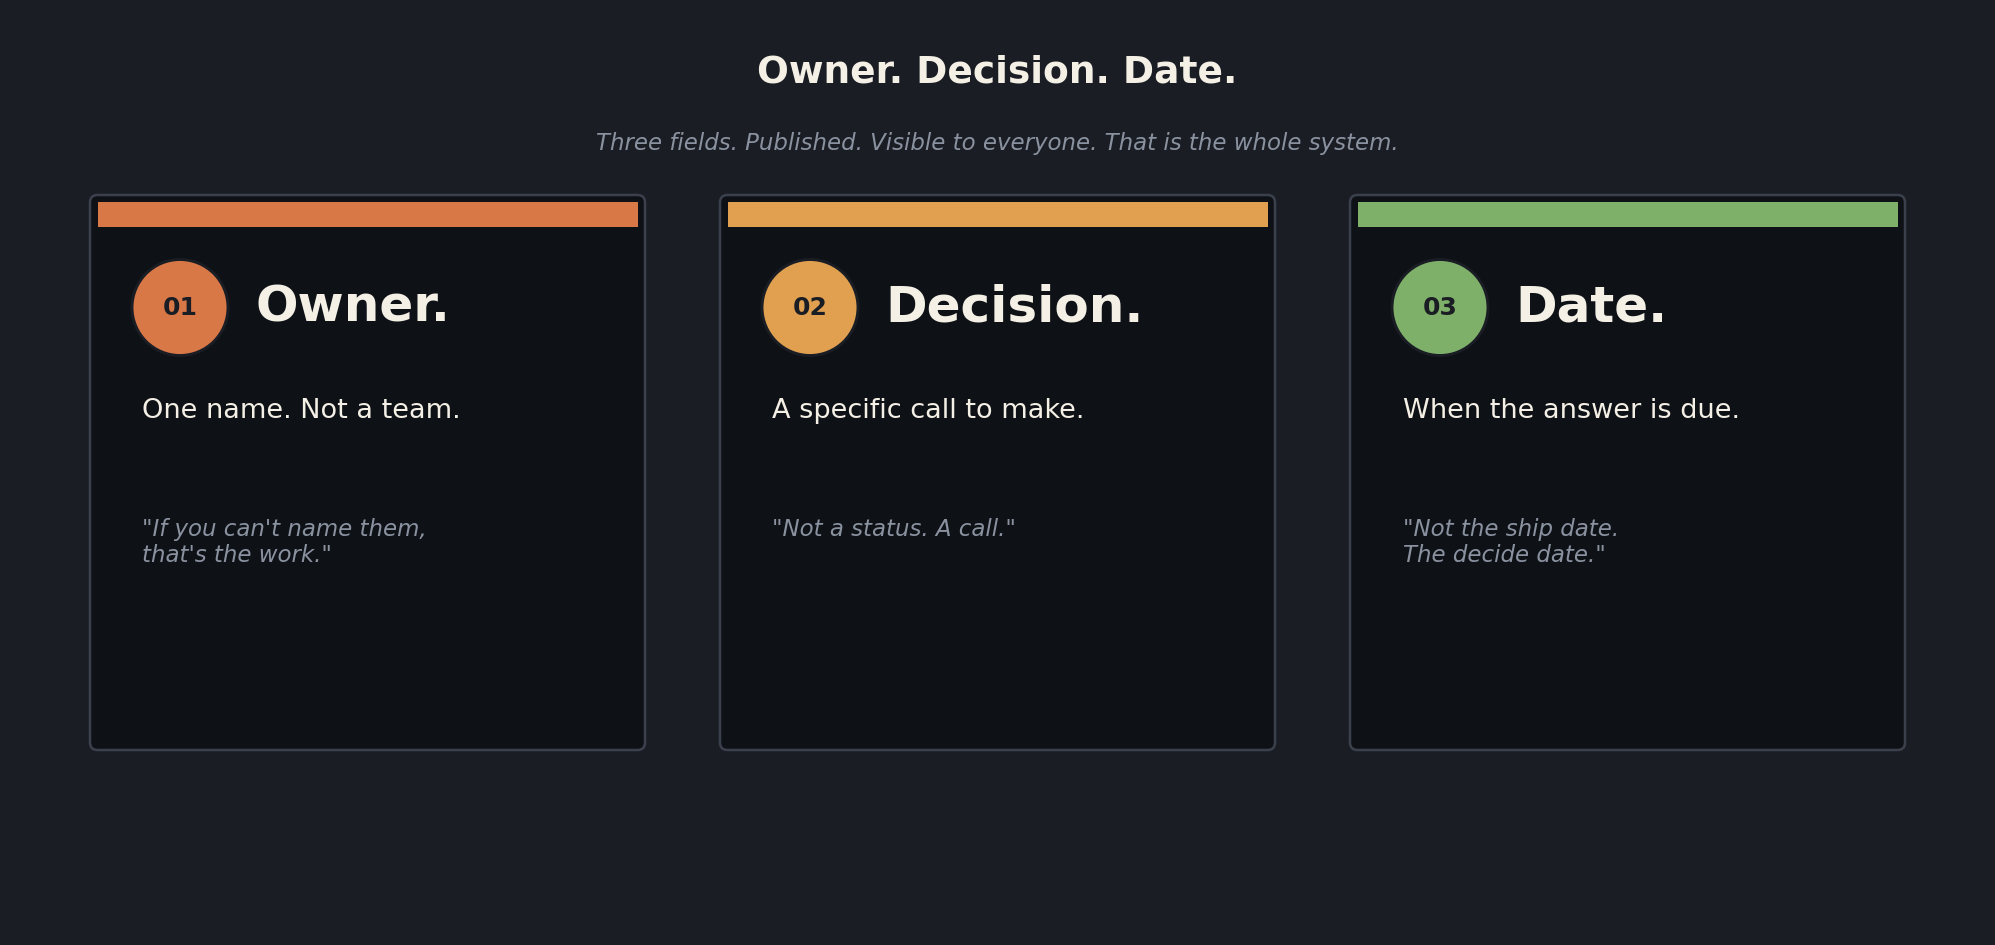
This is the slide I told the room to photograph. The flow is: Unowned → Owner → Decision → Date → Decided. You can implement it in a Google Sheet on Monday morning. You do not need a new tool. You do not need a project to roll it out. You need one column per field and the discipline to keep it current.
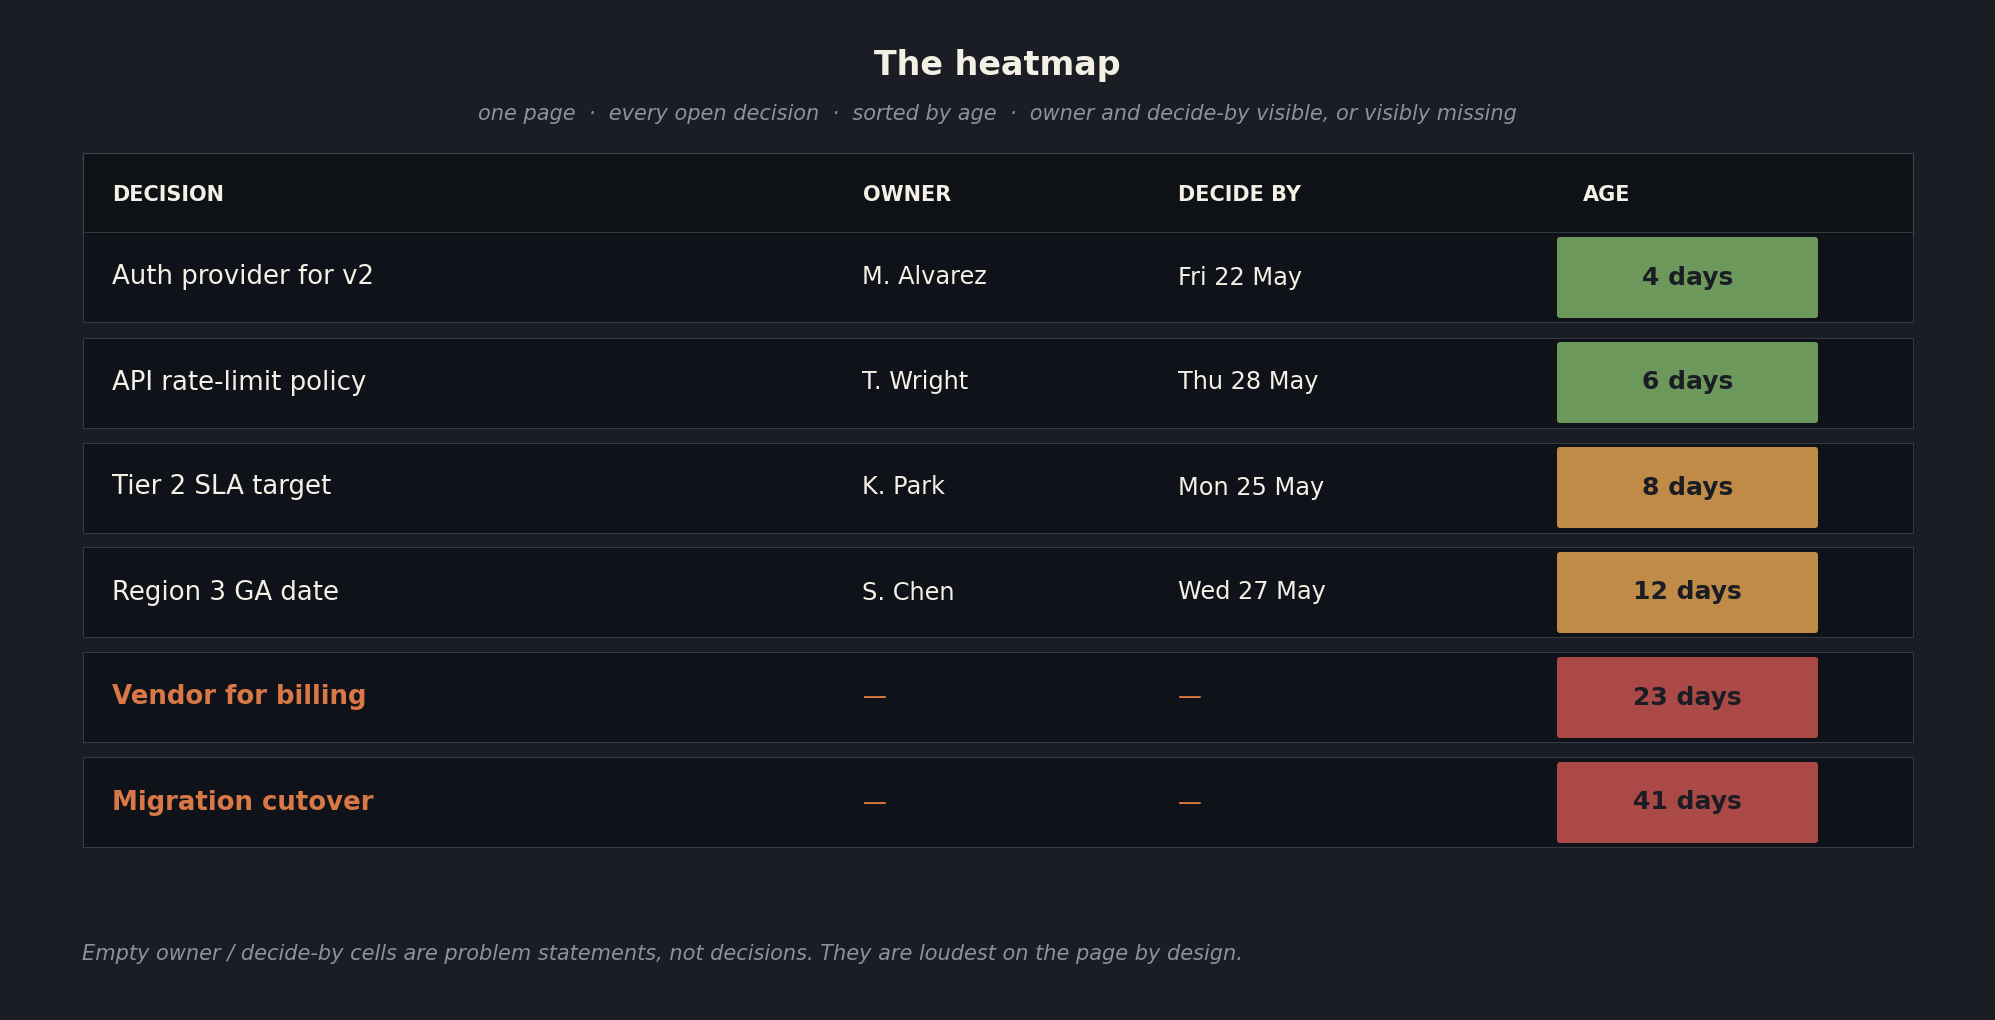
The artifact: the heatmap
The visible form of the system is a one-page heatmap. Every open decision on the program, sorted by age. Owner and decide-by either present, or visibly missing.
Three design choices matter more than the format.
First, sort by age, longest-open on top. Counts are the easiest thing to game. Ages are not. The decision that has been waiting 41 days is the conversation you should have first; it is also the conversation you have been avoiding longest.
Second, color by lifespan, not by importance. Green for fresh, amber for warming, red for stale. Importance is subjective. Lifespan is a fact about the system.
Third, leave the empty owner cells empty. Do not invent owners to fill in the blanks. The empty cells are the loudest things on the page by design. "Vendor for billing" with no owner and 23 days of age is a problem statement, not a decision. Problem statements need owners assigned before they become decisions. That is the work the heatmap surfaces.
What it looks like in the wild
A composite case, with the shape preserved and the names changed.
A large program. Red on the status report for nine weeks. The executive sponsor had asked three times, "What do you need?" The PM had answered "nothing" three times. The dashboard showed 47 green indicators and 2 red. The 47 were uninformative; the 2 were unactionable.
We replaced the dashboard with one page. Open decisions, named owners, decision dates. Nothing else.
Week 1 after the replacement: eleven decisions resolved. Two had been open for more than a quarter. Nobody had been blocking those decisions. Nobody had known they could make them.
The decisions were not hard. They were unassigned.
The impact
Same program, twelve weeks of data. The line is average days to decide on an open issue. The heatmap was published in week 10.
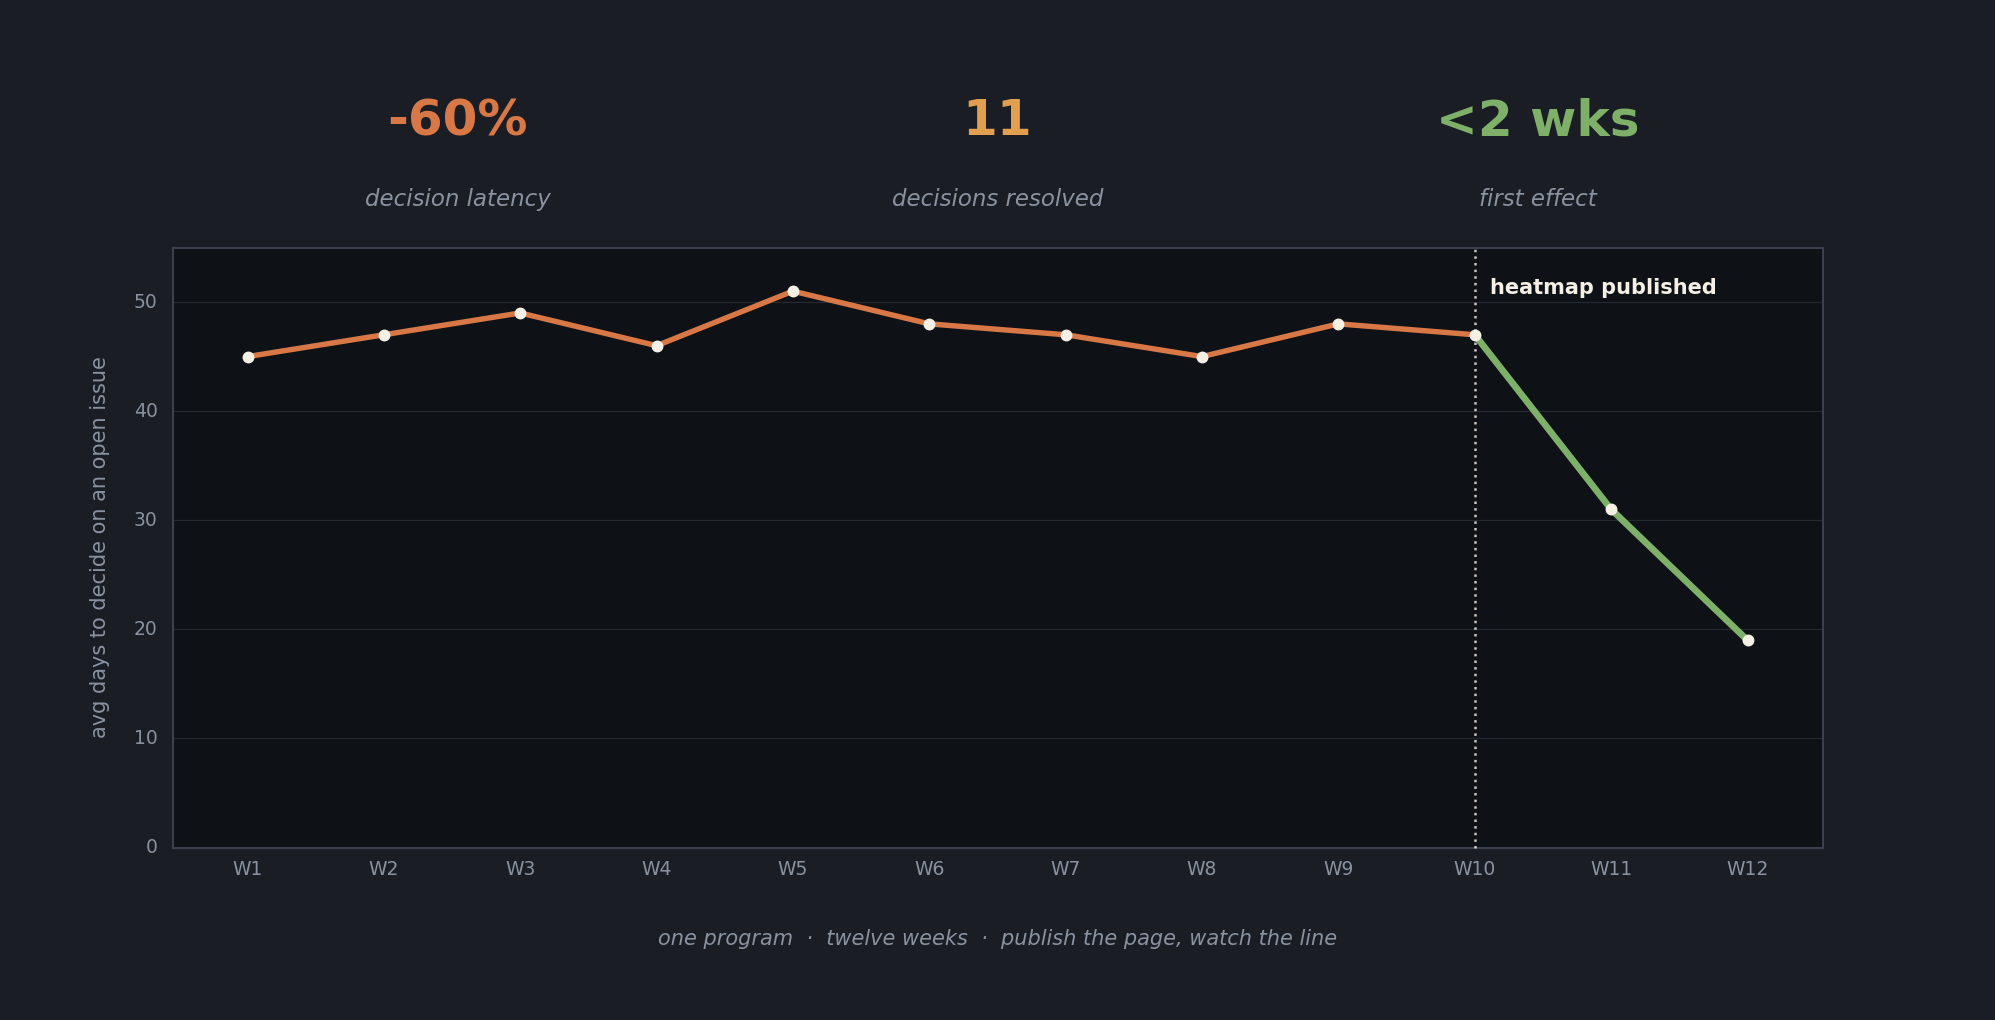
Nine flat weeks. A line that did not respond to status meetings, to escalations, to "what do you need." Intervention at week 10. The floor falls out of the line. -60 percent decision latency. Eleven decisions resolved. First measurable effect in under two weeks.
The chart drops the week we made the system visible. Visibility is the intervention.
The emergent benefit: the org chart writes itself
Run the system for a quarter and something useful happens that you did not design for. The org chart writes itself.
Deciders surface. The people who consistently close decisions become visible. They are often not the loudest voices, and they are sometimes not on the official org chart.
Domains cluster. Pricing decisions all route to one person. Security to another. The actual decision graph of the company becomes legible.
Bottlenecks show. One name on nine open decisions is not a hero. It is a capacity problem the org needs to fix.
Responsibilities tighten. Roles snap to who actually closes loops, not who is nominally accountable.
The org chart you publish and the org chart that emerges from decision data are different documents. The second one is more honest.
What to do Monday
Four moves. Small enough to ship before lunch.
- Pick one program. Not the portfolio. One program.
- List every open decision. Force one name next to each. If the cell is empty, that is your first finding.
- Add a decision date. When the decision must exist, not when the work ships.
- Show it. Do not email it. Open the page on a call. Team and sponsor, same view.
Then watch the 7-day change. The line will move. After the first program, do the next program. And the next.
One rule on the rollout: coach, do not command. Culture changes when the new behavior is visible. Praise the second person to try the heatmap. Instrument, do not grade.
A note on the room
Pittsburgh's product community is one of my favorite rooms to talk to. Real practitioners, sharp questions, low tolerance for theater. If you missed Product Camp Pittsburgh 2026, put 2027 on your calendar.
The questions after the talk converged on two themes, both of which deserve their own posts: how to introduce the heatmap when your culture punishes visibility, and how the decision data should feed quarterly planning rather than just weekly cadence. Both are coming. In the meantime, the deck is below.
Download the deck
The slide deck is available as both PowerPoint and PDF. Use it, adapt it, present a variant inside your organization. Attribution appreciated but not required.
Related reading from this site:
- Status Reports That Lie: Three Signals That Predict Project Failure — the data foundation for the heatmap.
- From Gantt to Graph: Why Modern Project Management Demands Technical Fluency — how the decision heatmap fits in the broader shift from schedule manager to system steward.
- When to Burn the Plan: A Tactical Re-Baseline Playbook for Slipping Programs — the members-only playbook for what to do when the heatmap shows you the program is past saving on its current baseline.
The best answers are probably already in the room.
References
- Product Camp Pittsburgh 2026. pghpcamp.com
- DORA. Accelerate State of DevOps Research. dora.dev — the decision-latency dynamic generalizes the code-review-latency finding to executive decisions.
- Google. Site Reliability Engineering Workbook. sre.google — the discipline of one-page operational artifacts comes from SRE practice.
- Skelton and Pais. Team Topologies. teamtopologies.com — for the team-boundary and dependency-cost framing behind the three-personas view.