
Dependency Density: A Better Risk Signal Than Critical Path for AI-Era Programs
Critical path was built for projects with clean linear chains. Modern programs do not look like that anymore. Dependency density is the metric that actually predicts which clusters will slip, and how to score, track, and act on it.
Critical path was a fine tool when programs looked like Gantt charts. A linear chain of tasks, one feeding the next, with a single longest sequence whose length set the floor for delivery. Drop a task on the chain, the program slips by that amount. Clean, defensible, easy to socialize to executives.
The problem is that almost nothing your teams are building right now looks like that.
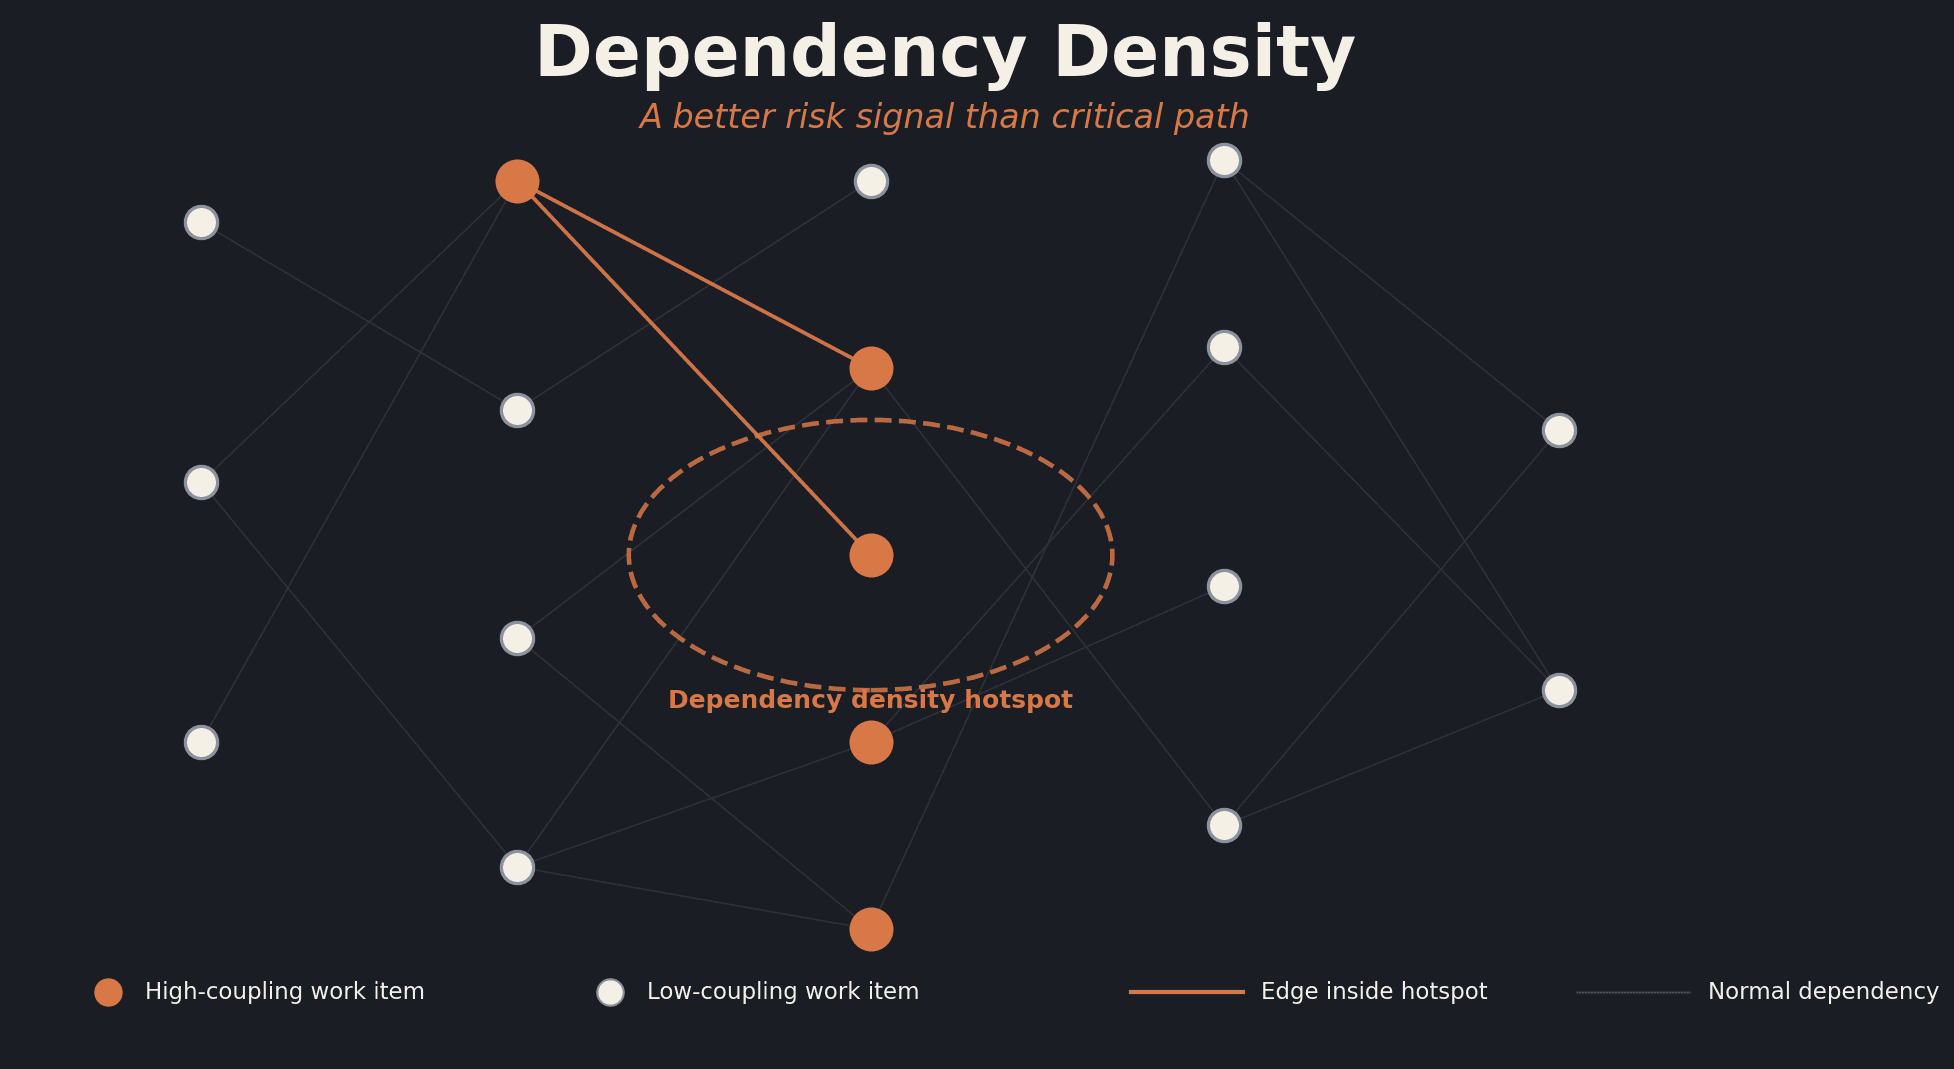
Modern programs are graphs, not chains. A payments cutover touches the ledger, the reconciler, fraud rules, the rate limiter, three internal APIs, and a vendor SDK that was deprecated last quarter. An agentic AI rollout depends on a feature store, an eval harness, a routing layer, a guardrail service, and a data contract that two upstream teams own but neither maintains. The longest single chain through that mess is still computable. It just stops being useful as a predictor of when the thing will ship.
The signal that actually predicts slip in graph-shaped programs is dependency density. The more edges per node in a cluster of work, the more ways that cluster can break, and the worse your odds of hitting the date. I have seen this play out across enough programs now, in both the agile and the technical project management corners of the discipline, that I am ready to argue you should be tracking it as a first-class metric. Critical path becomes a sanity check; density becomes the headline.
Why critical path stopped working
Critical path method assumes three things that modern delivery violates constantly.
It assumes you know all the tasks up front. In a discovery-heavy product, an agentic AI build, or anything where the architecture is still settling, the task list is a moving target. You can run CPM on it, but you are running it on yesterday's plan.
It assumes dependencies are sequential. Most of the dependencies that hurt you in modern delivery are not "this must finish before that starts." They are "these two systems must agree on a contract before either can ship," or "this team's roadmap blocks four other teams' roadmaps for the next quarter." Those are coupling, not sequencing.
It assumes one chain dominates. Critical path is the single longest path through the network. In a dense graph, there are often five or six nearly identical paths, and a small slip on a non-critical task pushes the critical path onto a new chain. Your headline number gets reshuffled weekly. Executives notice. Trust erodes.
I covered an adjacent symptom of this in When to Burn the Plan, which is what to do once your existing baseline has stopped predicting anything. Density is the leading indicator that gets you to the rebaseline conversation earlier, before the slip is irreversible.
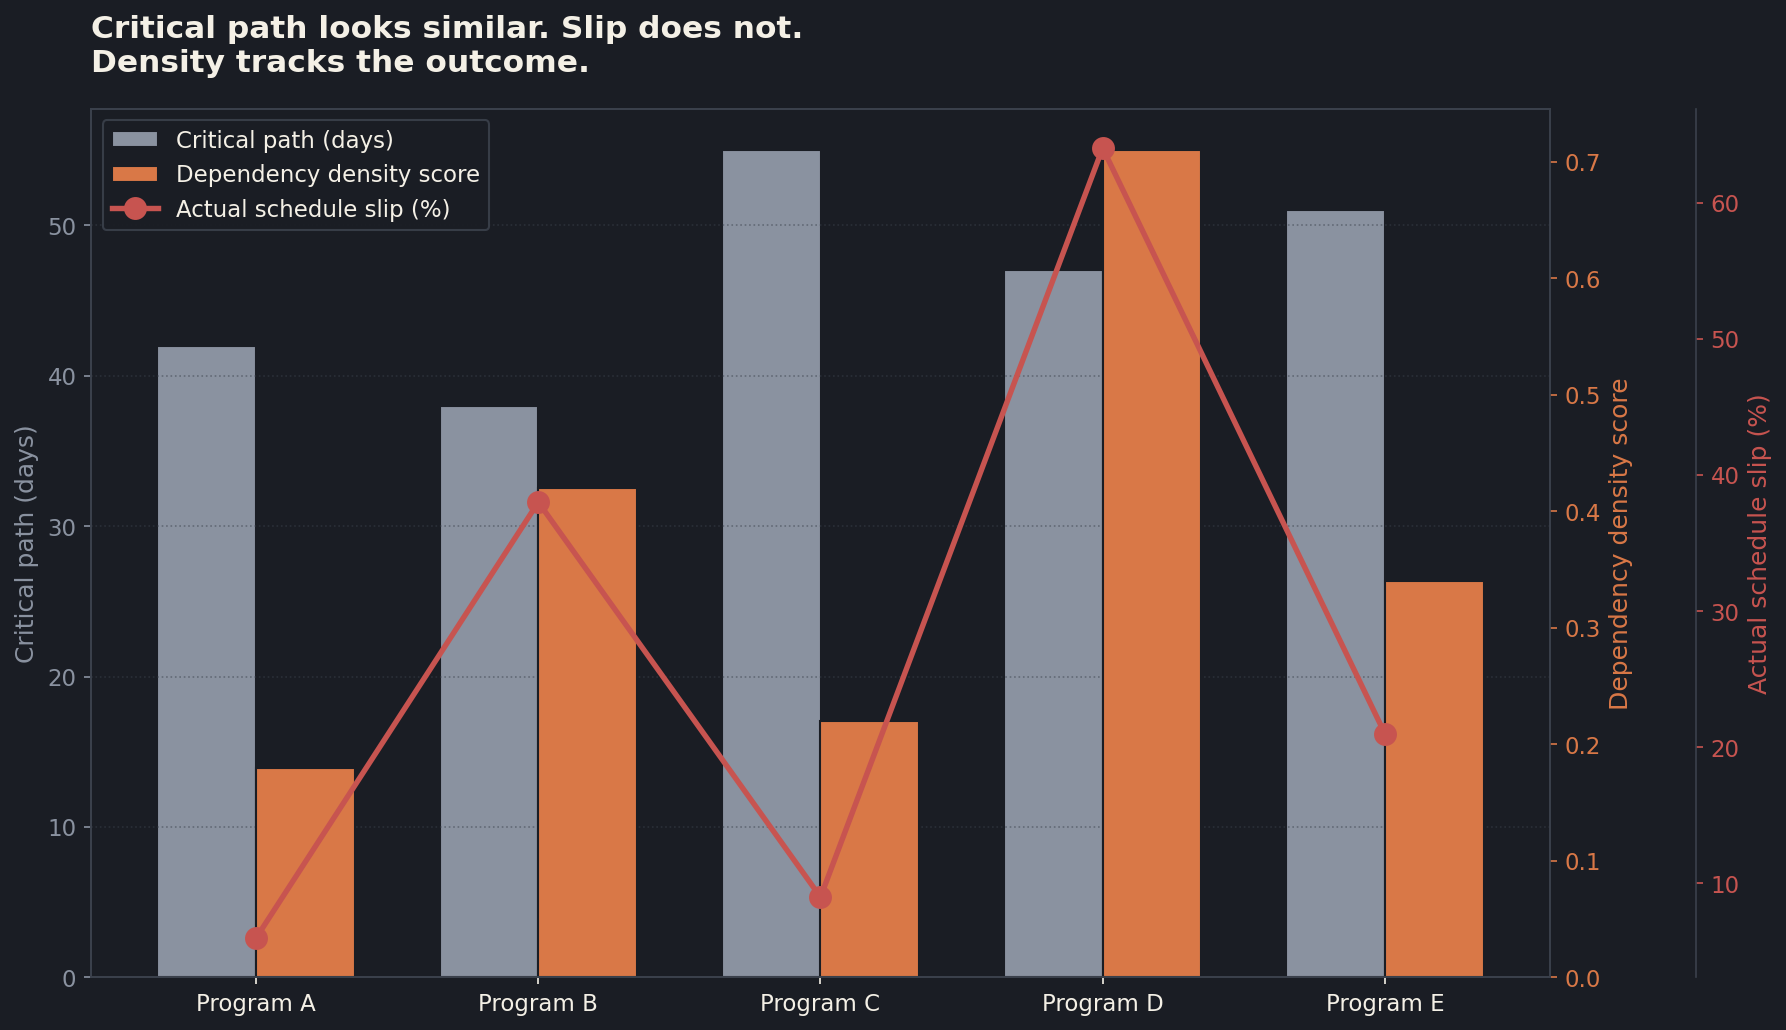
The chart above is a composite from a handful of programs I have worked on or advised. Five programs with very similar critical path lengths, all within a fifteen-day spread. The dependency density scores look completely different, and the actual end-of-program slip percentages track the density numbers almost perfectly. If you had been managing those five programs with critical path alone, you would have called Program D and Program A roughly the same risk. Program D slipped 64 percent. Program A slipped 6.
What dependency density actually is
The metric is simpler than the framing makes it sound.
For a cluster of work items, count the edges between them and divide by the number of nodes. Edges include the obvious sequencing constraints, but also API calls, shared data contracts, shared on-call rotations, shared platform services, and cross-team coordination requirements. Anything that means "if this changes, that has to change too" counts as an edge.
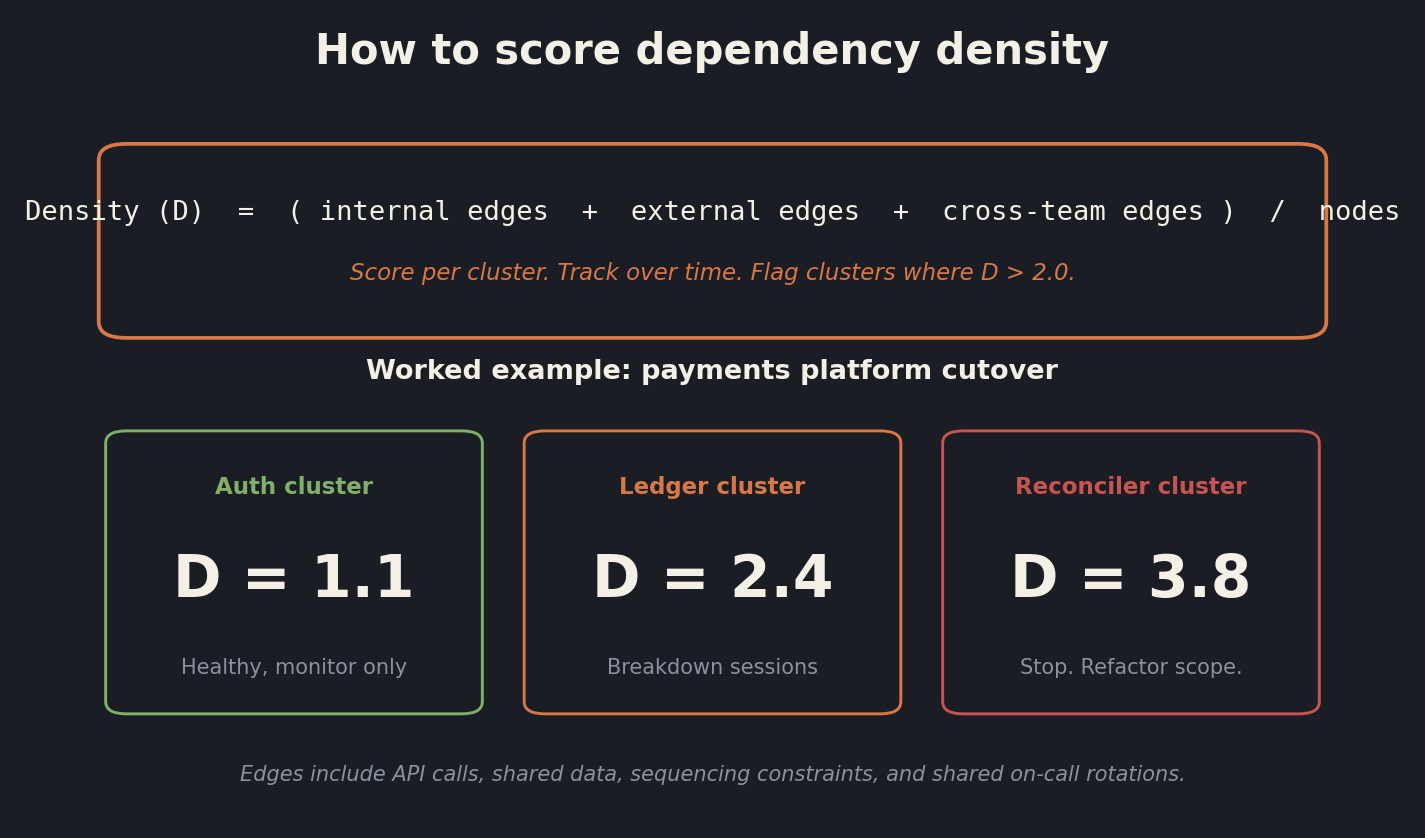
A density score below 1.0 is healthy. Between 1.0 and 2.0, you want active monitoring and a weekly breakdown of edge changes. Above 2.0, you need to stop adding scope and start refactoring the cluster, either by collapsing boundaries (merging two services that have become a distributed monolith) or by genuinely decoupling them with a contract layer that absorbs change. Above 3.0, the cluster is not going to ship on the date. The math is not going to surprise you. The only question is how much earlier you can have the honest conversation.
Counting edges in practice
The hard part is not the formula, it is being honest about what counts as an edge. Teams routinely undercount because admitting to a dependency creates a planning burden, and overcount when they want to escalate scope reduction. I use four categories:
Code-level edges. Direct API calls, shared libraries, shared schemas. Easy to count from architecture diagrams or service graphs.
Data-level edges. Shared data stores, event streams two services both consume, batch jobs that build one system's outputs from another's tables. These get missed constantly because the contract is implicit.
Process-level edges. Shared on-call rotations, shared release trains, shared change advisory boards. If two teams cannot ship independently because they share a release window, that is an edge.
Human-level edges. Two work items that need the same individual to approve, the same architect to design, or the same legal review to clear. These look softer but they bite hardest because they have no ticket associated with them.
Score each category, sum them, divide by nodes. Track it sprint over sprint.
Trends matter more than absolute numbers
A single density score is a snapshot. The trend tells you whether you are converging or diverging, and the trend is what you should actually be reporting to leadership.
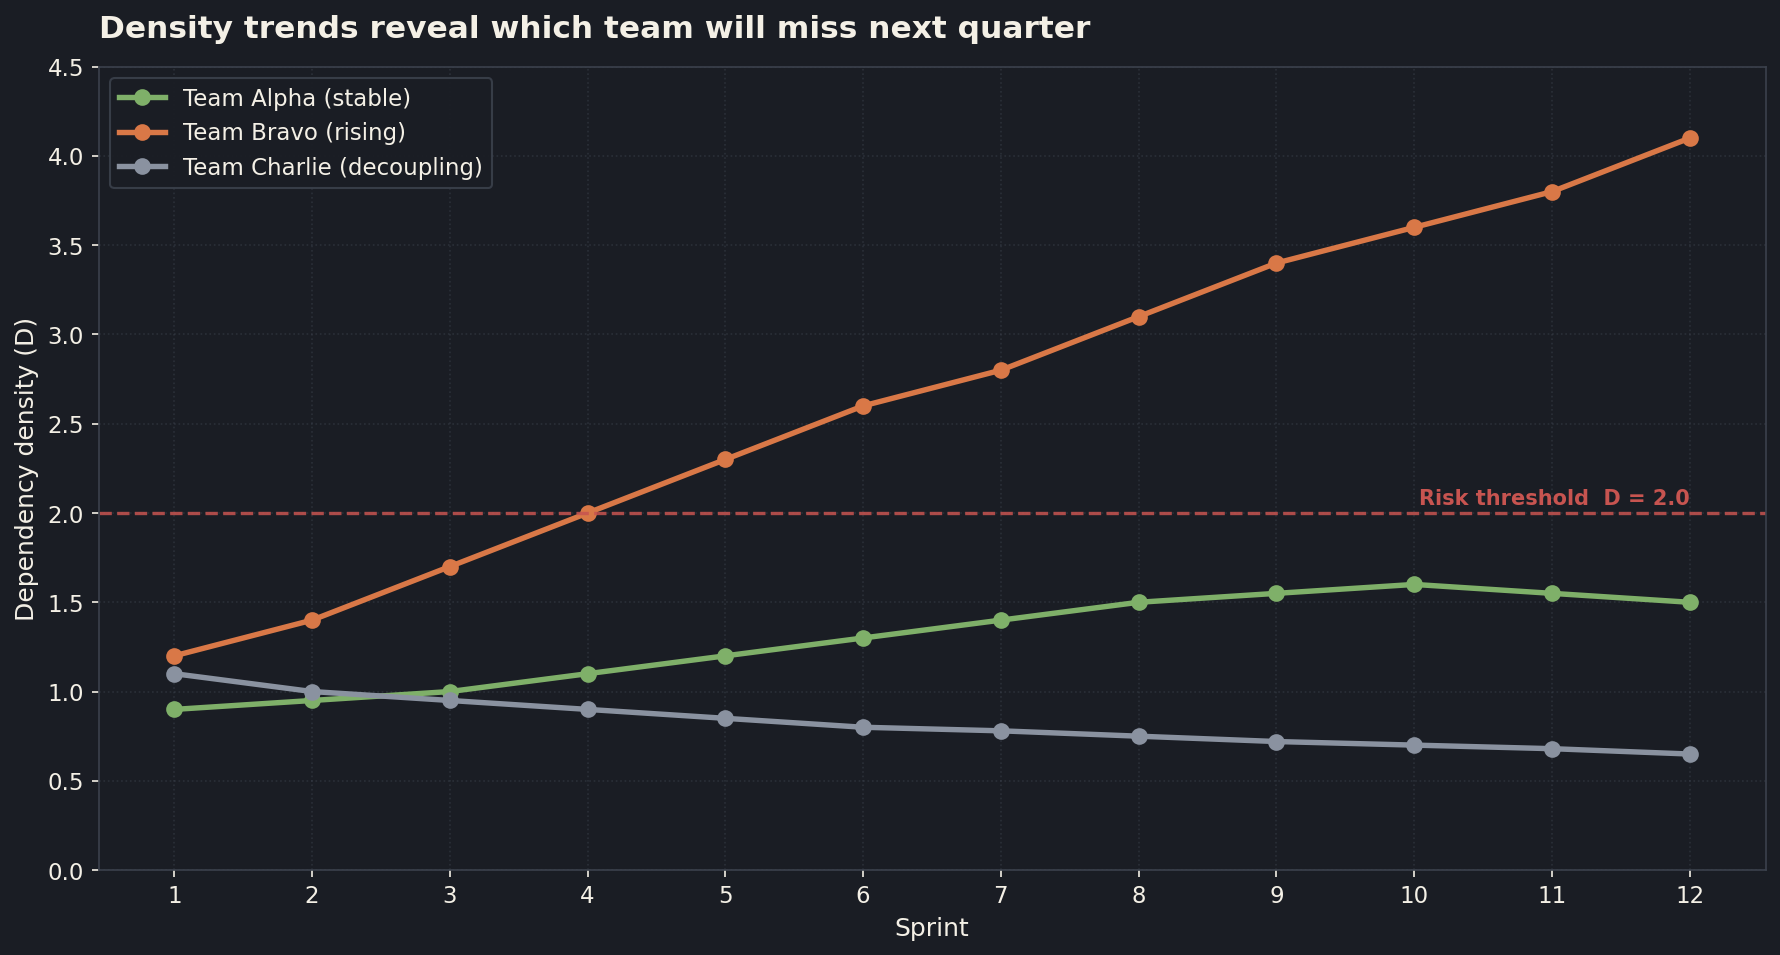
Three teams, twelve sprints. Team Alpha sits around 1.5 the entire time. That team will hit its dates, give or take a sprint. Team Bravo crosses the risk threshold at sprint five and keeps climbing. By sprint seven you should have called the rebaseline. By sprint nine the slip is already locked in, you are just deciding how to communicate it. Team Charlie is doing the work nobody gets credit for: actively decoupling, retiring shared dependencies, paying down the integration tax. Their density goes down over time. They will not deliver fewer features. They will deliver them more predictably.
The trend view also gives you a way to credit decoupling work. One of the longest-running frustrations in technical program management is that platform investments, integration cleanup, and contract hardening do not show up in feature throughput. They show up in dependency density going down. Once you start charting it, the work becomes visible. Engineers stop having to fight for it as overhead. It becomes a tracked KPI.
How this changes architecture decision records
This is where dependency density starts to influence the architecture practice, not just the program management practice. If you are running an ADR (architecture decision record) process, your records currently capture decisions and their consequences. They rarely capture the density impact.
I have started recommending that every ADR include a one-line density estimate. "This decision adds 3 edges to the payments cluster, raising D from 1.7 to 2.0." That tiny annotation does two things. It forces the architect proposing the change to count their own edges, which immediately filters out the worst proposals. And it gives the program a running ledger of where coupling is being added intentionally versus accidentally.
This is the same instinct I described in ADR Comeback: Anchoring Agentic Engineering Teams, where I argued ADRs are due for a renaissance specifically because agentic engineering teams need durable artifacts to anchor decisions across model-driven implementation. Density annotations make the artifact even more useful, because they tie an architecture decision to a schedule risk in a single number.
What you do when density gets out of hand
The right response when a cluster crosses D = 2.0 is rarely "work harder." It is one of three structural moves.
Collapse. Merge two services that have become a distributed monolith. If every change to A requires a coordinated change to B, those are not two services, they are one service in two repositories. Merging them eliminates a category of edges entirely and is almost always faster than the alternative.
Decouple with a contract. Insert a stable API or event contract between two clusters that absorbs future change. This is more work up front. It pays back the moment one side wants to move.
Reduce scope. Cut the work items that contribute the most edges, even if they are individually small. Density is multiplicative, not additive. Removing one high-edge work item often drops a cluster's density more than removing three low-edge ones.
The rule of thumb that has held up for me: if a cluster's density doubles between two sprints, you have already lost the date. The honest move is to surface it that week, propose one of the three structural fixes, and recalibrate. The dishonest move is to keep reporting green until the integration sprint, at which point everyone is angry and nobody trusts the schedule again for a quarter.
Where AI-era programs make this worse
Agentic AI delivery is the place where this matters most right now, and the place where teams get it most wrong. An agent build pulls in a feature store, an eval harness, a model gateway, a routing layer, a guardrail service, a logging pipeline, and a human-in-the-loop review interface. Every one of those is a cluster of its own. Every one of those clusters has edges to your existing product surface and to your existing data platform. The integration density is brutal, and most of it shows up as "we are blocked on the platform team" or "the eval suite is flaky again."
The teams shipping agents successfully are the ones who treated the integration density as the program risk, not the model quality. Model quality is a feature problem. Density is a delivery problem. Get the density right and your model swaps become trivial. Get it wrong and every model upgrade is a six-week regression hunt.
I expanded on this delivery-versus-model tension in Why Your Agentic AI Strategy Will Fail Without Product Thinking. Dependency density is the operational metric that makes the strategic argument concrete. When a leader asks "why are we not shipping faster," you point at the cluster with D = 3.4 and explain what it would take to bring it down. That conversation is far more productive than another sprint of vague velocity complaints.
Adopting this without a six-month rollout
You do not need a tool to start tracking density. You need a spreadsheet, an honest read of your architecture, and one PM willing to recount edges every sprint. Pick the three highest-risk clusters in your program. Score them this week. Score them again next week. Watch what the numbers do.
After two or three sprints, you will have a feel for which clusters are stable, which are creeping, and which are sprinting toward 3.0 while everyone tells you things are fine. That is when density earns its place on the program dashboard, next to or in front of critical path.
Critical path is not wrong. It is just no longer the right headline. Dependency density is.
References
- Project Management Institute. A Guide to the Project Management Body of Knowledge (PMBOK Guide). pmi.org
- Martin Fowler. Microservices and the First Law of Distributed Objects. martinfowler.com
- ThoughtWorks Technology Radar. Architecture Decision Records. thoughtworks.com
- DORA. State of DevOps Report. dora.dev
- Team Topologies. Cognitive Load and Team Interaction Modes. teamtopologies.com