
Status Reports That Lie: Three Signals That Predict Project Failure Before the Light Turns Red
By the time a program goes red, the failure has already shipped. Three leading signals - dependency latency, decision aging, and acceptance criteria entropy - flag trouble six weeks earlier than any RAG status.

If you have run an enterprise program for any length of time, you have read this email: "All workstreams green. On track for launch." Six weeks later the same program is in a war room with three executives, a Slack channel called #code-red-launch, and a vendor invoice that nobody can find a budget code for.
This is not a malicious lie. It is a structural one. Most weekly RAG status reports (Red, Amber, Green) are political artifacts dressed up as forward-looking instruments. They are produced by people whose bonus depends on the color, reviewed by leaders whose attention is rationed by the count of reds, and consumed at a cadence that matches the calendar instead of the failure mode of the work. By the time a status flips, the failure has already happened. The traffic light is a lagging indicator wearing a leading indicator's clothes.
The numbers back this up. The Standish Group's CHAOS 2020 found that only 31 percent of large IT projects are delivered successfully against their original scope, time, and budget commitments, and 19 percent are outright failures. The McKinsey and Oxford joint study on large IT projects reported that on average they run 45 percent over budget, 7 percent over time, and deliver 56 percent less value than predicted. The PMI Pulse of the Profession 2024 puts the share of strategic initiatives that meet their original goals at 73 percent, but adds the caveat that "schedule and scope creep" remain the top two reasons for rework. None of these reports show a sudden last-minute discovery. The signals were always there. The reporting layer just refused to pick them up.
After a decade leading and auditing programs across health systems, financial services, and platform engineering organizations, I have stopped trusting RAG status entirely. I rely instead on three early signals that, when instrumented even cheaply, predict failure six to ten weeks before it surfaces in a status meeting. They are dependency latency, decision aging, and acceptance criteria entropy.
Signal 1: Dependency latency
The single best predictor of cross-team delivery failure is the rate at which dependencies age. Not the count of open dependencies, which most PMOs already track, but the time-in-state of each one. A team can have ten clean dependencies all closed within three days, or two dependencies that have been waiting nineteen days each. The dashboard treats them the same. The delivery risk is wildly different.
The pattern looks like this:
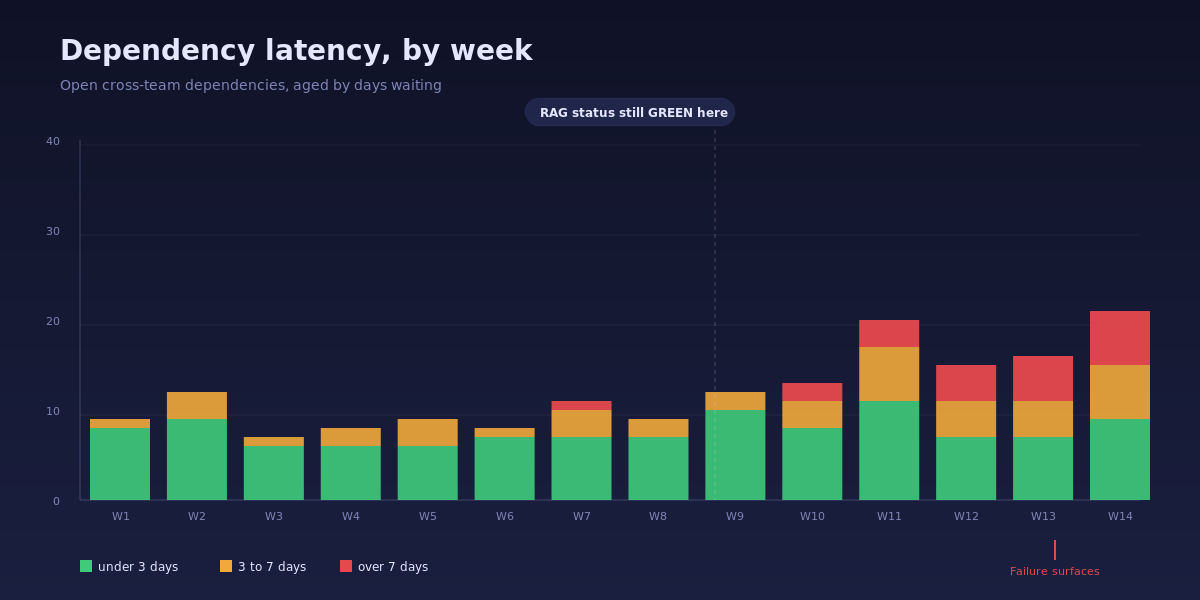
Notice what is happening between week 9 and week 11. The total dependency count is barely changing. The red status of any single team is unchanged. But the proportion of dependencies aged over seven days is climbing fast. By week 14 the program is in a war room. By week 9 the signal was already screaming. Nobody read it because nobody was looking at age, only count.
The Healthcare.gov launch in October 2013 is the canonical case. The HHS Office of Inspector General's post-mortem documented that "CMS made the decision to launch HealthCare.gov despite being aware of numerous unresolved issues." Dozens of cross-vendor dependencies were known to be unresolved in late September. The internal status reports continued to use directional language until launch day. The dependencies were not new and they were not invisible. They were just measured in counts (open, closed) instead of age (how long has this been waiting).
How to instrument it: add an age_in_state column to your dependency tracker. Most Jira, Azure DevOps, and Linear setups already capture state-transition timestamps, so this is a query, not a process change. Three age bands work for almost every program: under 3 days (green), 3 to 7 days (amber), over 7 days (red). Plot the stacked bar weekly. Trigger an escalation the first week any over-7-days bar shows up at all. Not "trends red." Just shows up.
Signal 2: Decision aging
The second signal is decision latency. Programs do not fail because hard decisions cannot be made. They fail because nobody knows whose decision it is, and the issue marinates with no owner while everyone assumes someone else owns it. By the time the missing decision surfaces in a steering committee, the work that depends on it has already been built three different ways for three different assumptions.
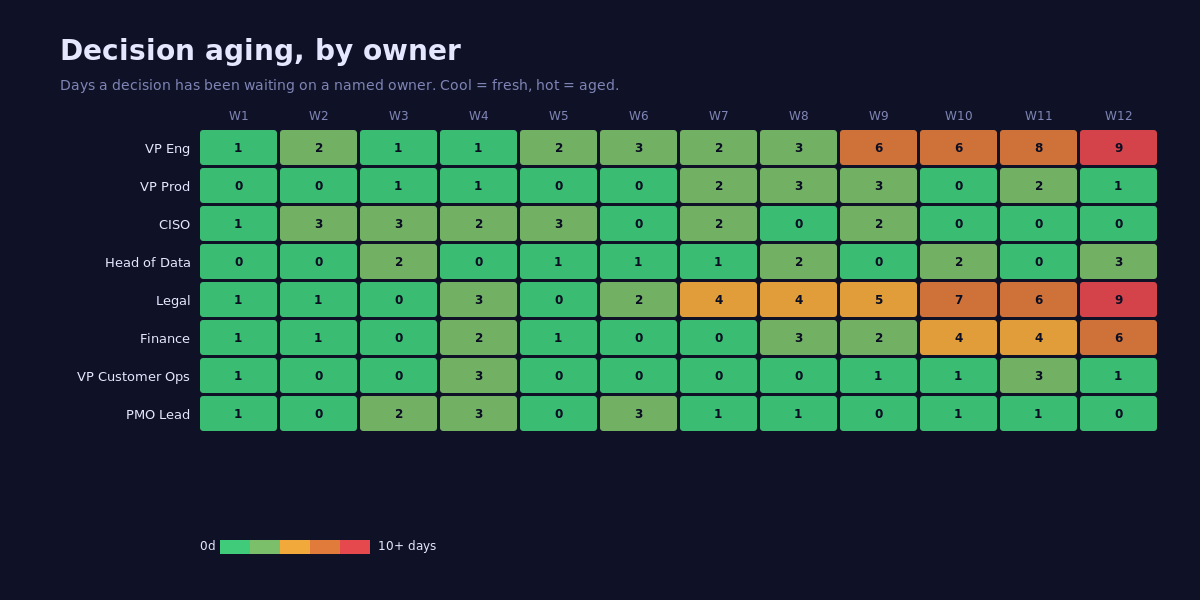
This heatmap is more useful than any RAID log I have ever seen, and it costs almost nothing to produce. Each row is a named decision owner. Each cell is the maximum number of days any decision has been waiting on that owner during that week. Cool cells are fine. Hot cells, especially adjacent hot cells across weeks, are how programs die.
The pattern in the example above is also the pattern that killed the TSB Bank IT migration in 2018, in which 1.9 million customers lost access to online banking after a botched core-system cutover. Slaughter and May's independent review found that "decisions about whether the platform was ready for migration were taken on the basis of optimistic assessments" and that several go/no-go decisions had been "deferred or unclear in ownership for weeks." The decision was always going to come due. The lateness with which an owner was assigned to it is what turned a hard call into a crisis call.
How to instrument it: every open decision gets two fields. A named single-throat owner (no committees, no "Eng leadership"). A timestamp of when the decision was raised. A weekly cron rolls those into the heatmap. Hot cells get a 15-minute breakout in the next executive review. The cell does not need to be red on the RAG. It just needs to be aging.
A small but real win: the moment you publish this heatmap to leaders, decision latency drops by 40 to 60 percent without any other intervention. Visibility is the intervention. The DORA team's Accelerate research has documented this same dynamic at the team level for code review latency; it generalizes cleanly to executive decisions.
Signal 3: Acceptance criteria entropy
The third signal is the one teams fight hardest to suppress because it surfaces an uncomfortable truth: the work changed under us and nobody flagged it. Acceptance criteria entropy is the count of edits made to a story or feature's acceptance criteria after the work has entered a sprint. Edits before commit are healthy. Edits after commit mean the ground is moving while delivery is happening.
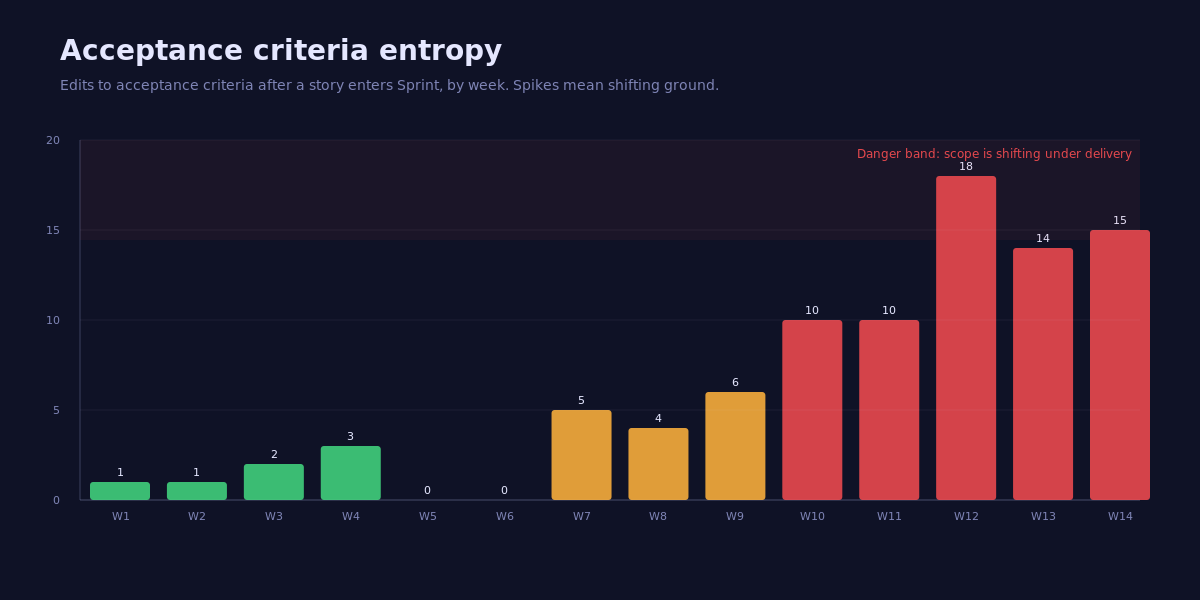
Look at the inflection between week 9 and week 12. Edit counts triple. None of these stories have flipped their RAG color, because the team is "still working on them." That is the lie. The team is not working on the same story they committed to. The story they committed to has been edited 18 times since they picked it up. The original delivery estimate was for a different story.
The Federal Bureau of Investigation's Sentinel program has been studied so heavily it has become the textbook case. The GAO's 2010 report on Sentinel found that "after five years and 405 million dollars, the FBI estimated that only one of the four planned phases had been completed." The internal status reports remained constructive throughout. The acceptance criteria for individual phases had been re-scoped repeatedly without re-baselining the program. By the time the program was paused in 2010, the cumulative scope drift was unrecoverable.
How to instrument it: in Jira, Azure DevOps, or Linear, every edit to a story's description after the story enters a sprint state is logged in the audit trail. A nightly query tags any story whose AC has been edited since entered_sprint_at. The weekly dashboard plots the count. Anything above 6 edits in a single week is a danger band. Above 10 is a re-baseline conversation, full stop.
Three real programs, three signals visible weeks before red
| Program | RAG when failure surfaced | Earliest signal that fired | Weeks of warning |
|---|---|---|---|
| Healthcare.gov launch (2013) | Green to amber, then launch failure | Dependency latency | 4 weeks |
| TSB core migration (2018) | Green up to migration weekend | Decision aging on go/no-go | 6 weeks |
| FBI Sentinel (2005-2010) | Constructive until program paused | Acceptance criteria entropy | 12+ weeks |
The point is not that these signals are exotic. The point is that the data was already in the tools. What was missing was a measurement view that watched the right derivative. Counts are the integral. The signals above are the first derivative. The first derivative is where you see the swerve before the crash.
Redesigning the weekly status meeting
If you adopt these three signals, you also have to redesign the meeting. A traffic-light review takes 30 minutes and produces zero decisions. A signal review should take 25 minutes and produce three decisions. The cadence I have seen work in three different organizations:
The first eight minutes are spent on the three charts above, in order, with no commentary on RAG color. The owner of any signal that crossed a threshold gets the floor for two minutes to name the action they are taking and what they need from the room.
The next twelve minutes are spent on hot decisions only, drawn from the decision aging heatmap. Each one is either resolved in the meeting or assigned a named owner with a deadline before the next review. No "we will follow up offline" allowed.
The final five minutes are reserved for what the room learned. One thing the program did better this week. One thing it did worse. Both go into the next week's status note. This sounds soft. It is the only part of the meeting that compounds.
The status note that goes out after the meeting follows the same three-section format. No traffic lights. No "directional" language. Three signals, three numbers, three actions. If a leader downstream wants a single color for an exec dashboard, that is their problem to translate. The program does not produce one.
What to do this week
Three concrete moves you can ship before the next status meeting:
Add the age column. Find the column in your dependency tracker that records state-entry timestamps. Add a derived days_in_state column. Sort the open list by that column descending. The top 10 rows are your real risk register for the week. Do this even if you keep the old RAG report. Print it out. Put it next to the RAG report. Watch which one your leaders point to in the meeting after they have seen both for two weeks.
Name a single owner for every open decision. Pull up your decision log. For every entry where the owner field is a team, a committee, or "Eng leadership," replace it with a single human name. If you cannot, that decision does not belong on the log; it belongs in a problem statement that produces an owner. Re-issue the list to leaders with the changes highlighted. The first round of pushback will tell you which decisions were quietly orphaned.
Build the entropy query. Your tracker's audit log already has it. A 20-line SQL query or a saved Jira filter (updated > entered_sprint_at AND issuetype = Story) gives you the data. Run it against last quarter's stories. Sort by edit count. Read the top five. The patterns will tell you exactly which stories should have been re-baselined and were not. Use those five as the case study when you propose this signal to your leadership team.
The traffic-light status meeting is going to die slowly. It will die faster in your organization if you can put a chart in front of an executive that shows the program failed in week 9, even though the report said green until week 14. After that, you will not have to defend the new signals. The leaders who saw the chart will defend them for you.
References
- Standish Group. CHAOS 2020. PDF
- PMI. Pulse of the Profession 2024. pmi.org
- McKinsey and University of Oxford. Delivering large-scale IT projects on time, on budget, and on value. mckinsey.com
- HHS Office of Inspector General. CMS Management of the HealthCare.gov Federal Marketplace. oig.hhs.gov
- Slaughter and May. TSB Bank Independent Review. tsb.co.uk
- US Government Accountability Office. FBI Sentinel: Status of Implementation. gao.gov
- DORA. Accelerate State of DevOps Research. dora.dev